
At the machine
Operators
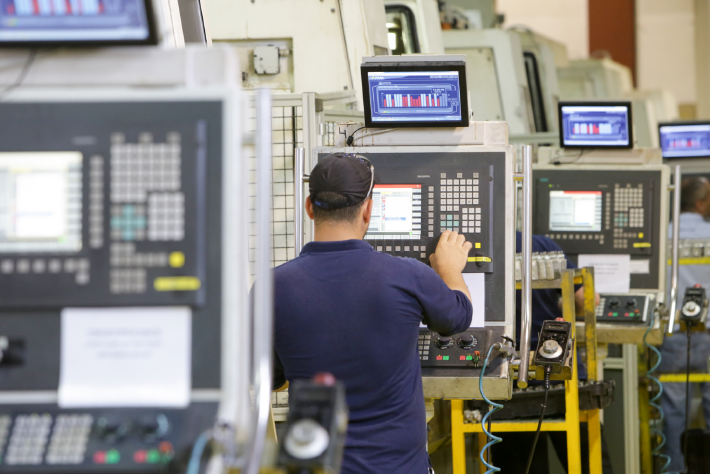
See the target for the current run and how the shift is tracking against it, on a display at the line instead of on a clipboard.
- Live target versus actual
- Immediate stop visibility
- No manual counting
Visual Factories automatically collects and analyzes machine activity, giving operators and managers accurate production information without manual data entry.
Trusted on production
floors worldwide















Drawing on any type of production machine, Visual Factories captures activity in real time, analyses it, and presents it through displays and reports that every level of the factory can read.
Machine activity is captured as it happens and presented as production information, not as raw signals.
Stops, slow cycles and unrecorded idle time become visible on a timeline instead of disappearing into the shift.
Performance is measured against realistic capacity per part and per machine, so improvement is measurable.
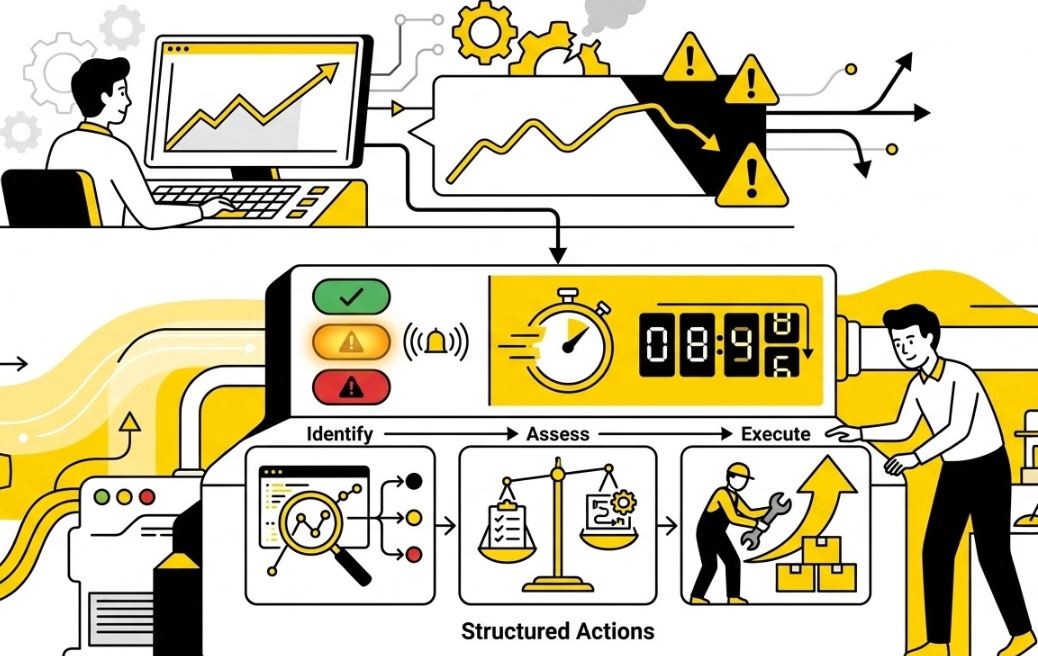
Each stage runs continuously, so the gap between something going wrong on the line and someone knowing about it closes to minutes.
01Machine running
Equipment runs its programme on the line.
02Signal collected
The monitoring unit captures activity automatically.
03Data analysed
Activity becomes state, count, cycle time and downtime.
04Loss identified
A stop or a slow cycle separates from the expected pace.
05Team alerted
Floor displays and reports show the loss as it happens.
06Action taken
The team responds inside the shift, not after it.
07Performance reviewed
The shift is reviewed against target, per machine.
A compact monitoring unit attaches to new or legacy equipment. No machine replacement, no production line rebuild.
Machine activity is captured automatically and continuously, removing manual counting and paper reporting.
Activity becomes production metrics: state, count against target, cycle time, downtime and efficiency.
Floor displays and role-based reports put the same numbers in front of operators, supervisors and management.
The overview film from Visual Factories, showing how machine monitoring reaches the shop floor.
Video hosted by Visual Factories on Vimeo. It only loads once you press play.
The same machine signal answers a different question depending on where you stand in the factory.
At the machine
See the target for the current run and how the shift is tracking against it, on a display at the line instead of on a clipboard.
Across the floor
See every connected machine at once and where the shift is losing output, while there is still time to intervene.
Across the plant
Track efficiency trends over time with the same underlying data the shop floor sees, rather than a separately assembled report.
Most discrete manufacturers already know their output is below target. What is missing is the minute-by-minute record that explains where it went.
A shift with 20 minutes of unrecorded stops
Demonstration timeline. Without automatic collection, the stopped and idle bands are simply absent from the shift record.
Visual Factories draws on any type of production machine, new equipment with modern controllers and legacy machines without them. Start with a single machine and expand across the floor as you go.
GE Fanuc, Siemens, Heidenhain and more
MTConnect, OPC UA
Or PLCs with no available API or assembly
Operable from the workstations you already use
The same collected data drives the shop-floor display and the management report. Here is what it shows, annotated.
Line 3, Machining cell
Shift A · Live production
OEE
0.0%
Actual output
0pcs
Downtime
0min
Avg. cycle time
0s
| Machine | State | Count | Target | Cycle |
|---|---|---|---|---|
| CNC-04 | Running | 812 | 840 | 44 s |
| PRESS-11 | Stopped | 388 | 620 | n/a |
| WELD-02 | Running | 1,174 | 1,120 | 31 s |
| ASSY-07 | Idle | 502 | 700 | 62 s |
Illustrative production view assembled from Visual Factories’ documented metrics, machine state, production count, target, actual output, cycle time, downtime and OEE. Figures are demonstration data, not customer results.
Every connected machine reports running, idle or stopped without an operator entering anything.
Production count is measured against the target for the part currently running, per machine and per product.
Stops appear on the shift timeline as they happen, so a loss can be addressed inside the shift.
Drill from the line summary to a single machine's count, target and cycle time in the same view.
The shift from manual reporting to automatic collection changes the working day for every role on the floor.
Stops and slowdowns surface as they happen, so a supervisor can act while the shift can still be recovered.
Production counts arrive from the machine itself, removing the manual tally sheets and the transcription behind them.
Floor displays, supervisor reports and management summaries all read from the same collected machine activity.
Actual cycle times and downtime patterns give planners a realistic basis for the targets they set.
Published case studies from Visual Factories customers, available as downloads.
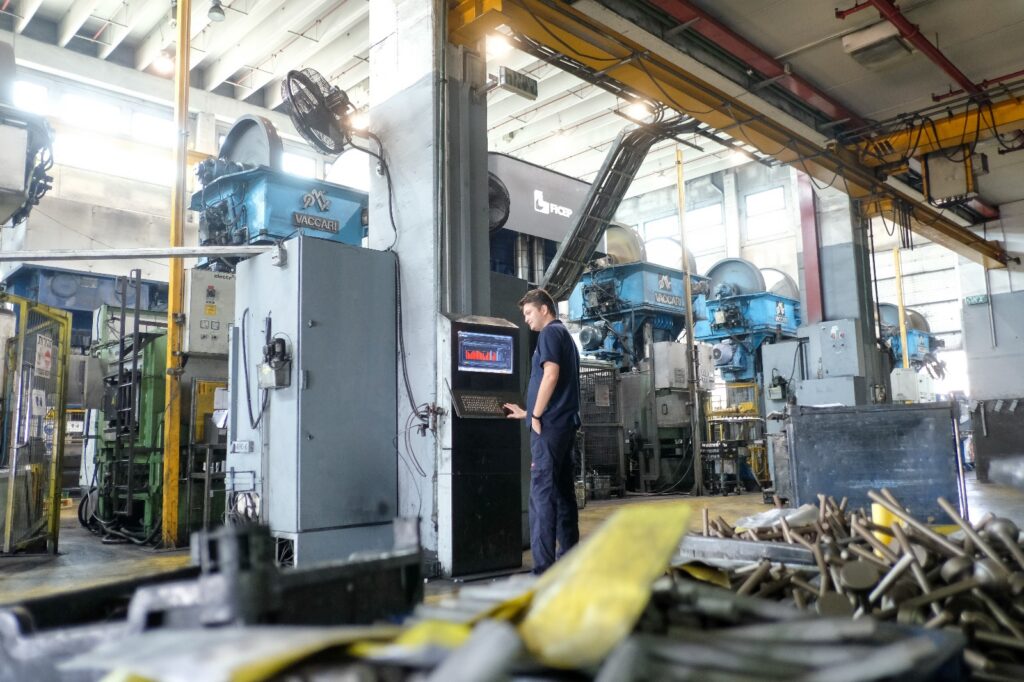
Discrete manufacturing, Peru
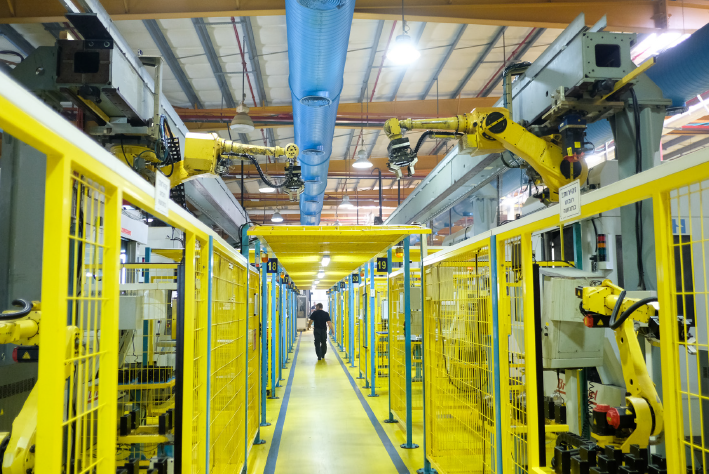
Cutting tool manufacturing
“Visual Factories simplicity and compatibility enabled us to connect all our machines on our own, and start monitor & analyze our performance in a matter of days.”
“We wanted a more trustworthy and real-time method to follow up on a production in our plant. With the Visual Factories solution, we are now able to identify weak links in our production which allows us to solve problems and increase productivity.”
“VF is the best investment I did in my 25 years in manufacturing.”
Recognizing the factories building what’s next
Celebrating manufacturing teams delivering measurable advances in factory floor innovation, operational performance, and continuous improvement.

Presented by Visual Factories
together with Tesla.
Visual Factories’ methodology was developed together with Tesla to help manufacturers identify losses, improve OEE, and turn factory floor data into action.
Selected winners receive
2027 nominations now being reviewed
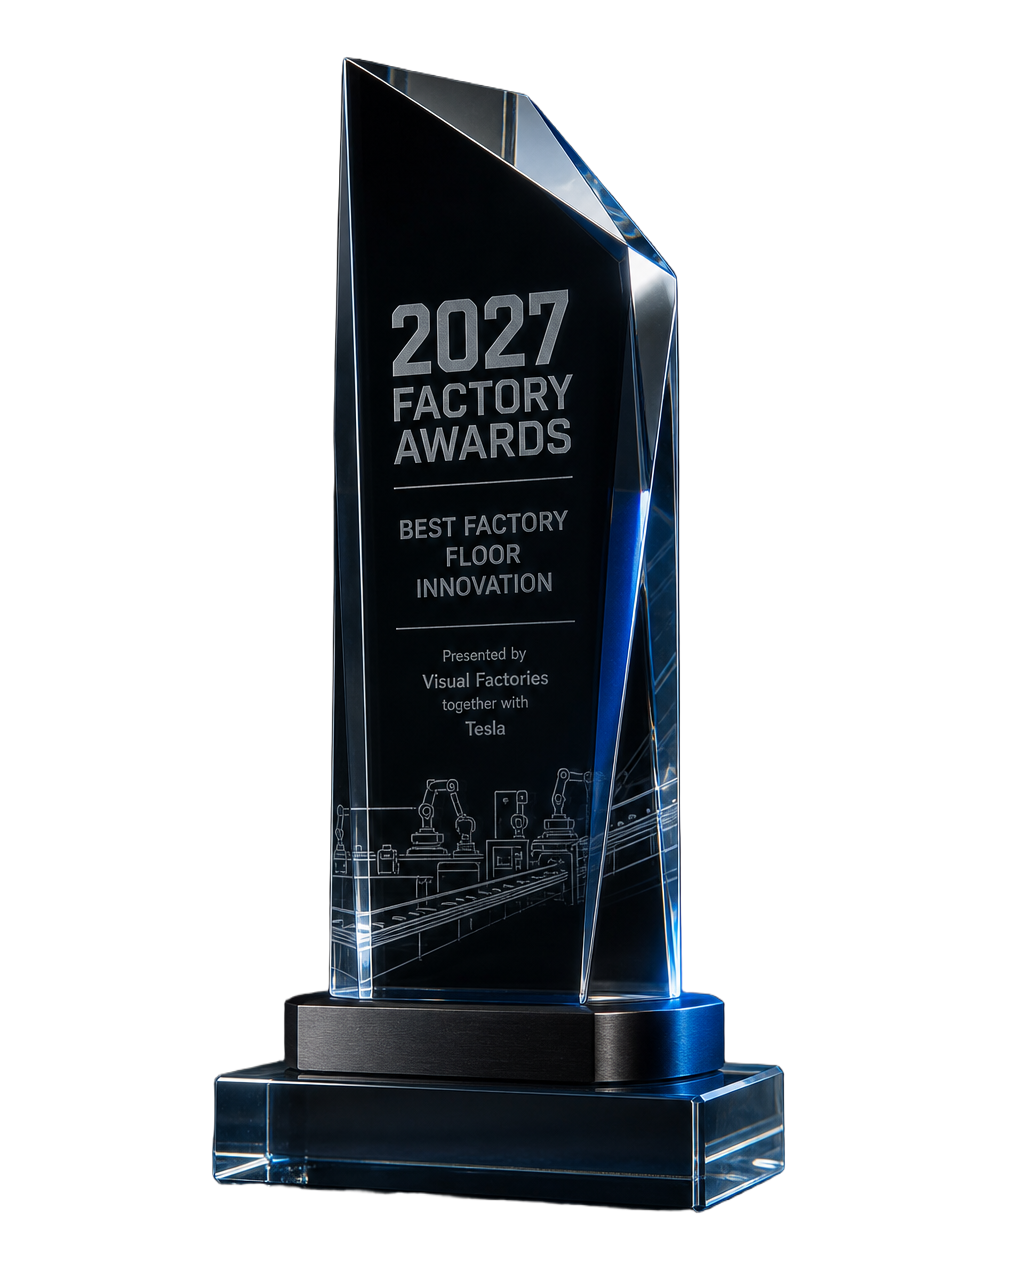
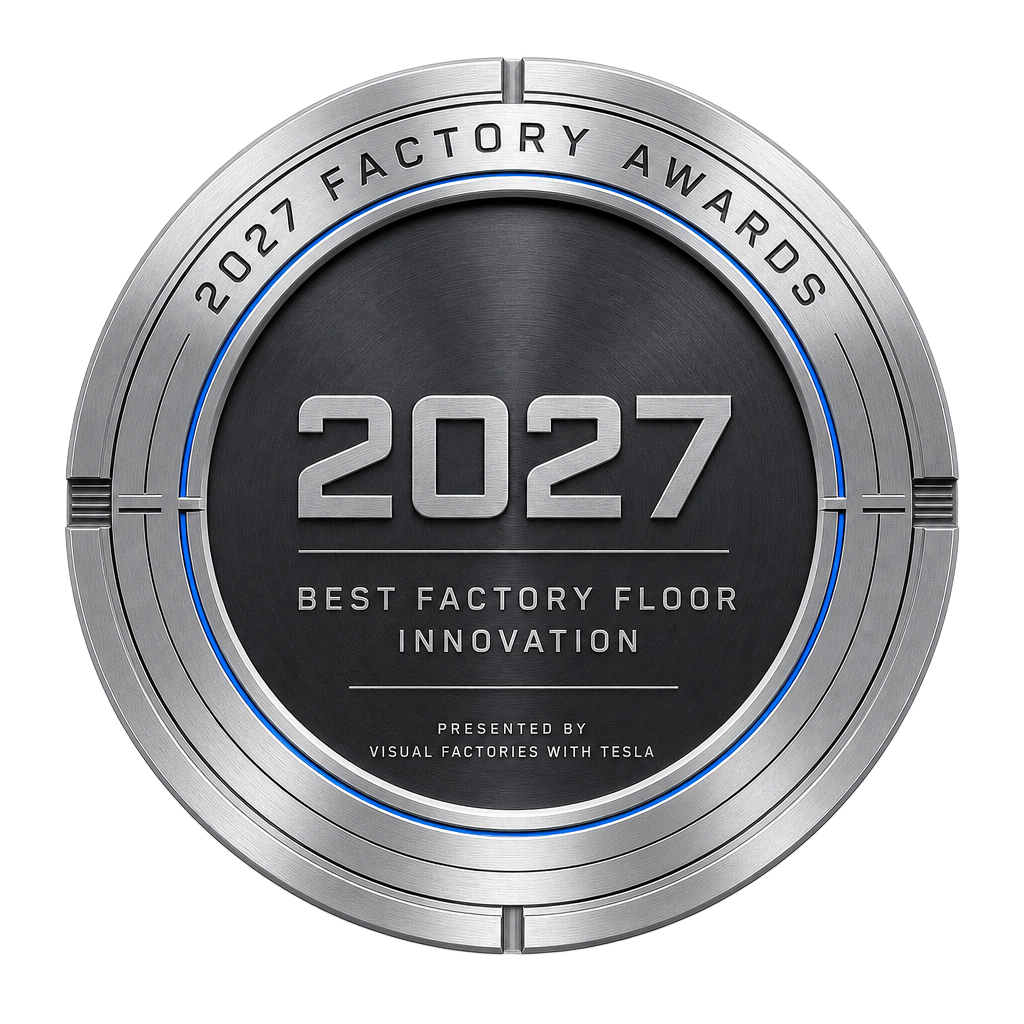
Best Factory Floor Innovation

Production data is commercially sensitive. Visual Factories runs as a cloud platform with named-account access under a certified information security management system.
See the privacy policy and terms and conditions for the current published statements.
Visual Factories continuously captures production machine activity and turns it into real-time monitoring, analysis and reporting, machine state, production pace, capacity per part and per machine, downtime and overall production performance, per line, per machine and per product.
The infrastructure is compatible with PLCs such as GE Fanuc, Siemens and Heidenhain, with machine communication standards including MTConnect and OPC UA, and with machines that have no PLC or no available PLC API.
Yes. Visual Factories is designed for mixed fleets. Machines with no PLC, or with a PLC that exposes no usable API, can be connected without replacing existing machinery.
No. The system draws directly on machine activity, so production data is collected without human input and without relying on manual reporting.
Visual Factories is an out-of-the-box product: quick to install on any machine, plug and play, and ready to use within hours. Customers describe going from decision to a working proof of concept in under a week.
Yes. Whether you want to monitor one machine or one hundred, a package is built around your needs, and the rollout can be gradual, one machine at a time.
Real-time machine state and production performance measurements, optimal capacity per part and per machine, early problem detection, root cause analysis, consumable consumption control and OEE.
Yes. The solution is cloud-based, so managers can compare lines, machines, products and shifts from any workstation, wherever they are.
You can sign up for a free trial with no obligation. Contact Visual Factories for a custom price quote and to start the trial; billing is on a monthly basis and you are free to cancel at any time with no penalty.
The platform is cloud-based with access through named user accounts. For the current, complete statement of how information is handled, see the privacy policy and the terms and conditions.
Visual Factories supports customers through the full journey, from the first machine connection to factory-wide visibility. Contact the team for the support terms that apply to your deployment.
Start with one machine
Request a demo and the Visual Factories team will show you what real-time monitoring looks like on machines like yours, and quote a package around them.